How to use DataLogViewer App
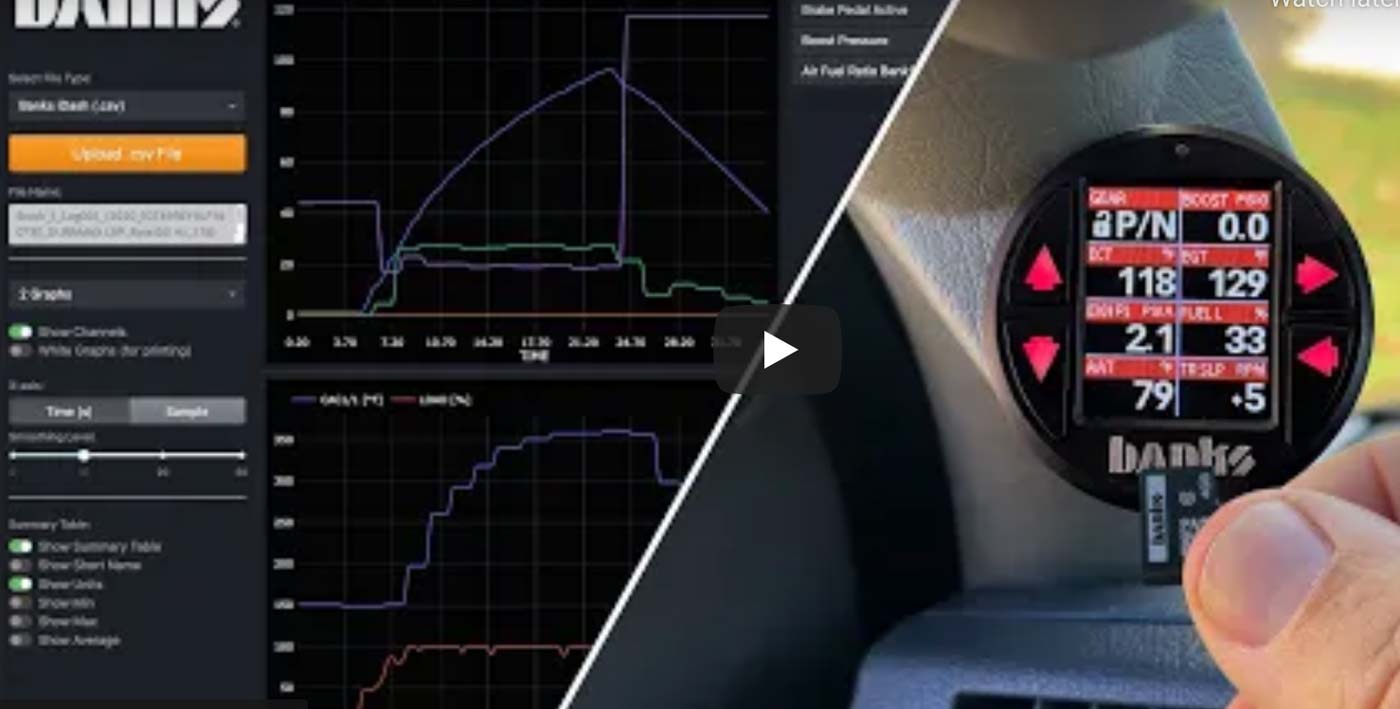
DataLogViewer.com is a free web app by Banks Power. View and analyze race data from your iDash DataMonster or other data logging system. Reviewing data logs is also helpful when troubleshooting vehicle issues. Simply upload your data log to the website and choose the parameters you want to analyze and compare. Zoom into any point in time for a closer look. Compare up to 4 parameters per graph on up to 4 graphs. Export screenshots for printing or sharing.
0:00 Free web-based viewer
0:15 How it works
2:35 Navigation
3:15 Summary table
4:00 Zoom navigation
4:50 Download and save

How DataLogViewer Works
The data logs are on the MicroSD card in your Banks iDash DataMonster. Remove the SD card from the iDash and slip it into your computer’s SD card reader.
Locate the data log you want to view in the finder and then upload it to DataLogViewer. When it’s uploading you will see a status bar highlighted below.
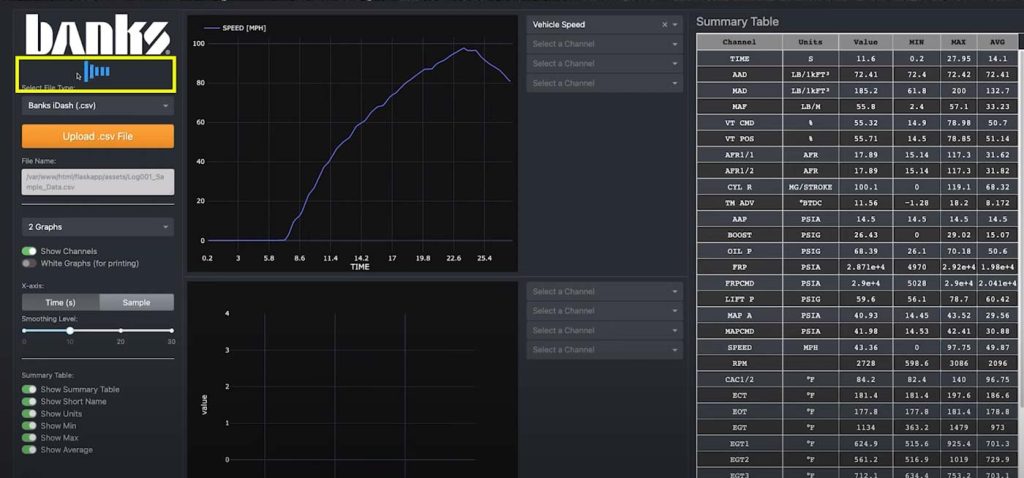
Once the upload is complete, you will see the new file name in the highlighted area which should match the name of the file you just selected.
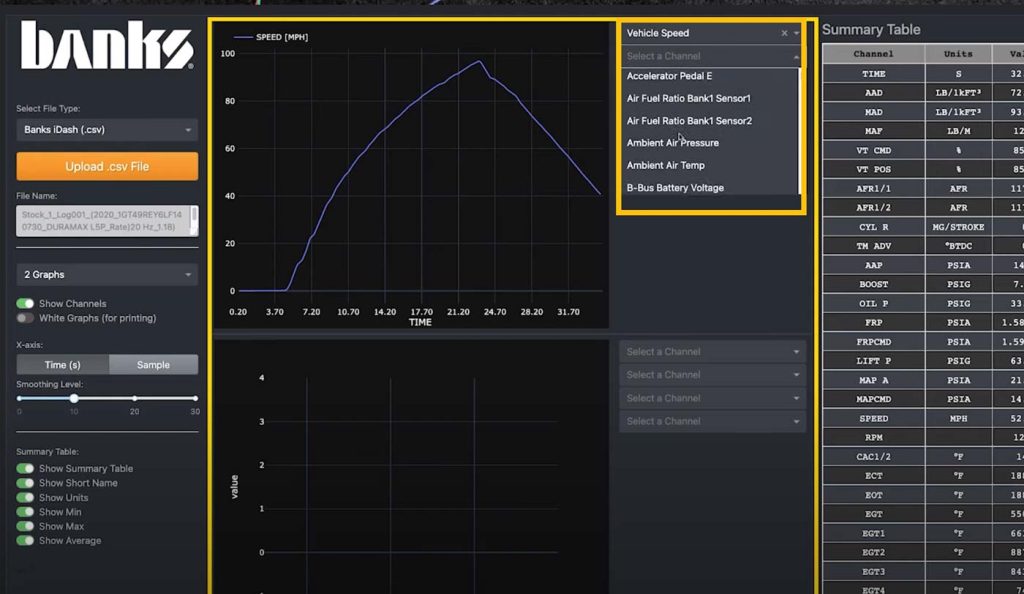
In the middle section, there is an X/Y graph and to the right, a drop-down menu with all of the recorded channels listed. You can do this for the bottom graph. Up to four graphs can be on display.
The Summary Table (to the right) provides a snapshot of different points in time by clicking on a specific time on the graph. The table will display all the parameters for that specific time. You can show the full names of each parameter by toggling off “Show Short Name” to the left.
Make a printer-friendly version of the graphs by toggling on “White Graphs” and clicking the camera icon at the top to download a PNG file.